 EMODnet Product Catalogue
CNR, Istituto di Scienze Marine (Sezione di Venezia)
Type of resources
Available actions
Topics
Keywords
Contact for the resource
Provided by
Years
Formats
Resolution
-
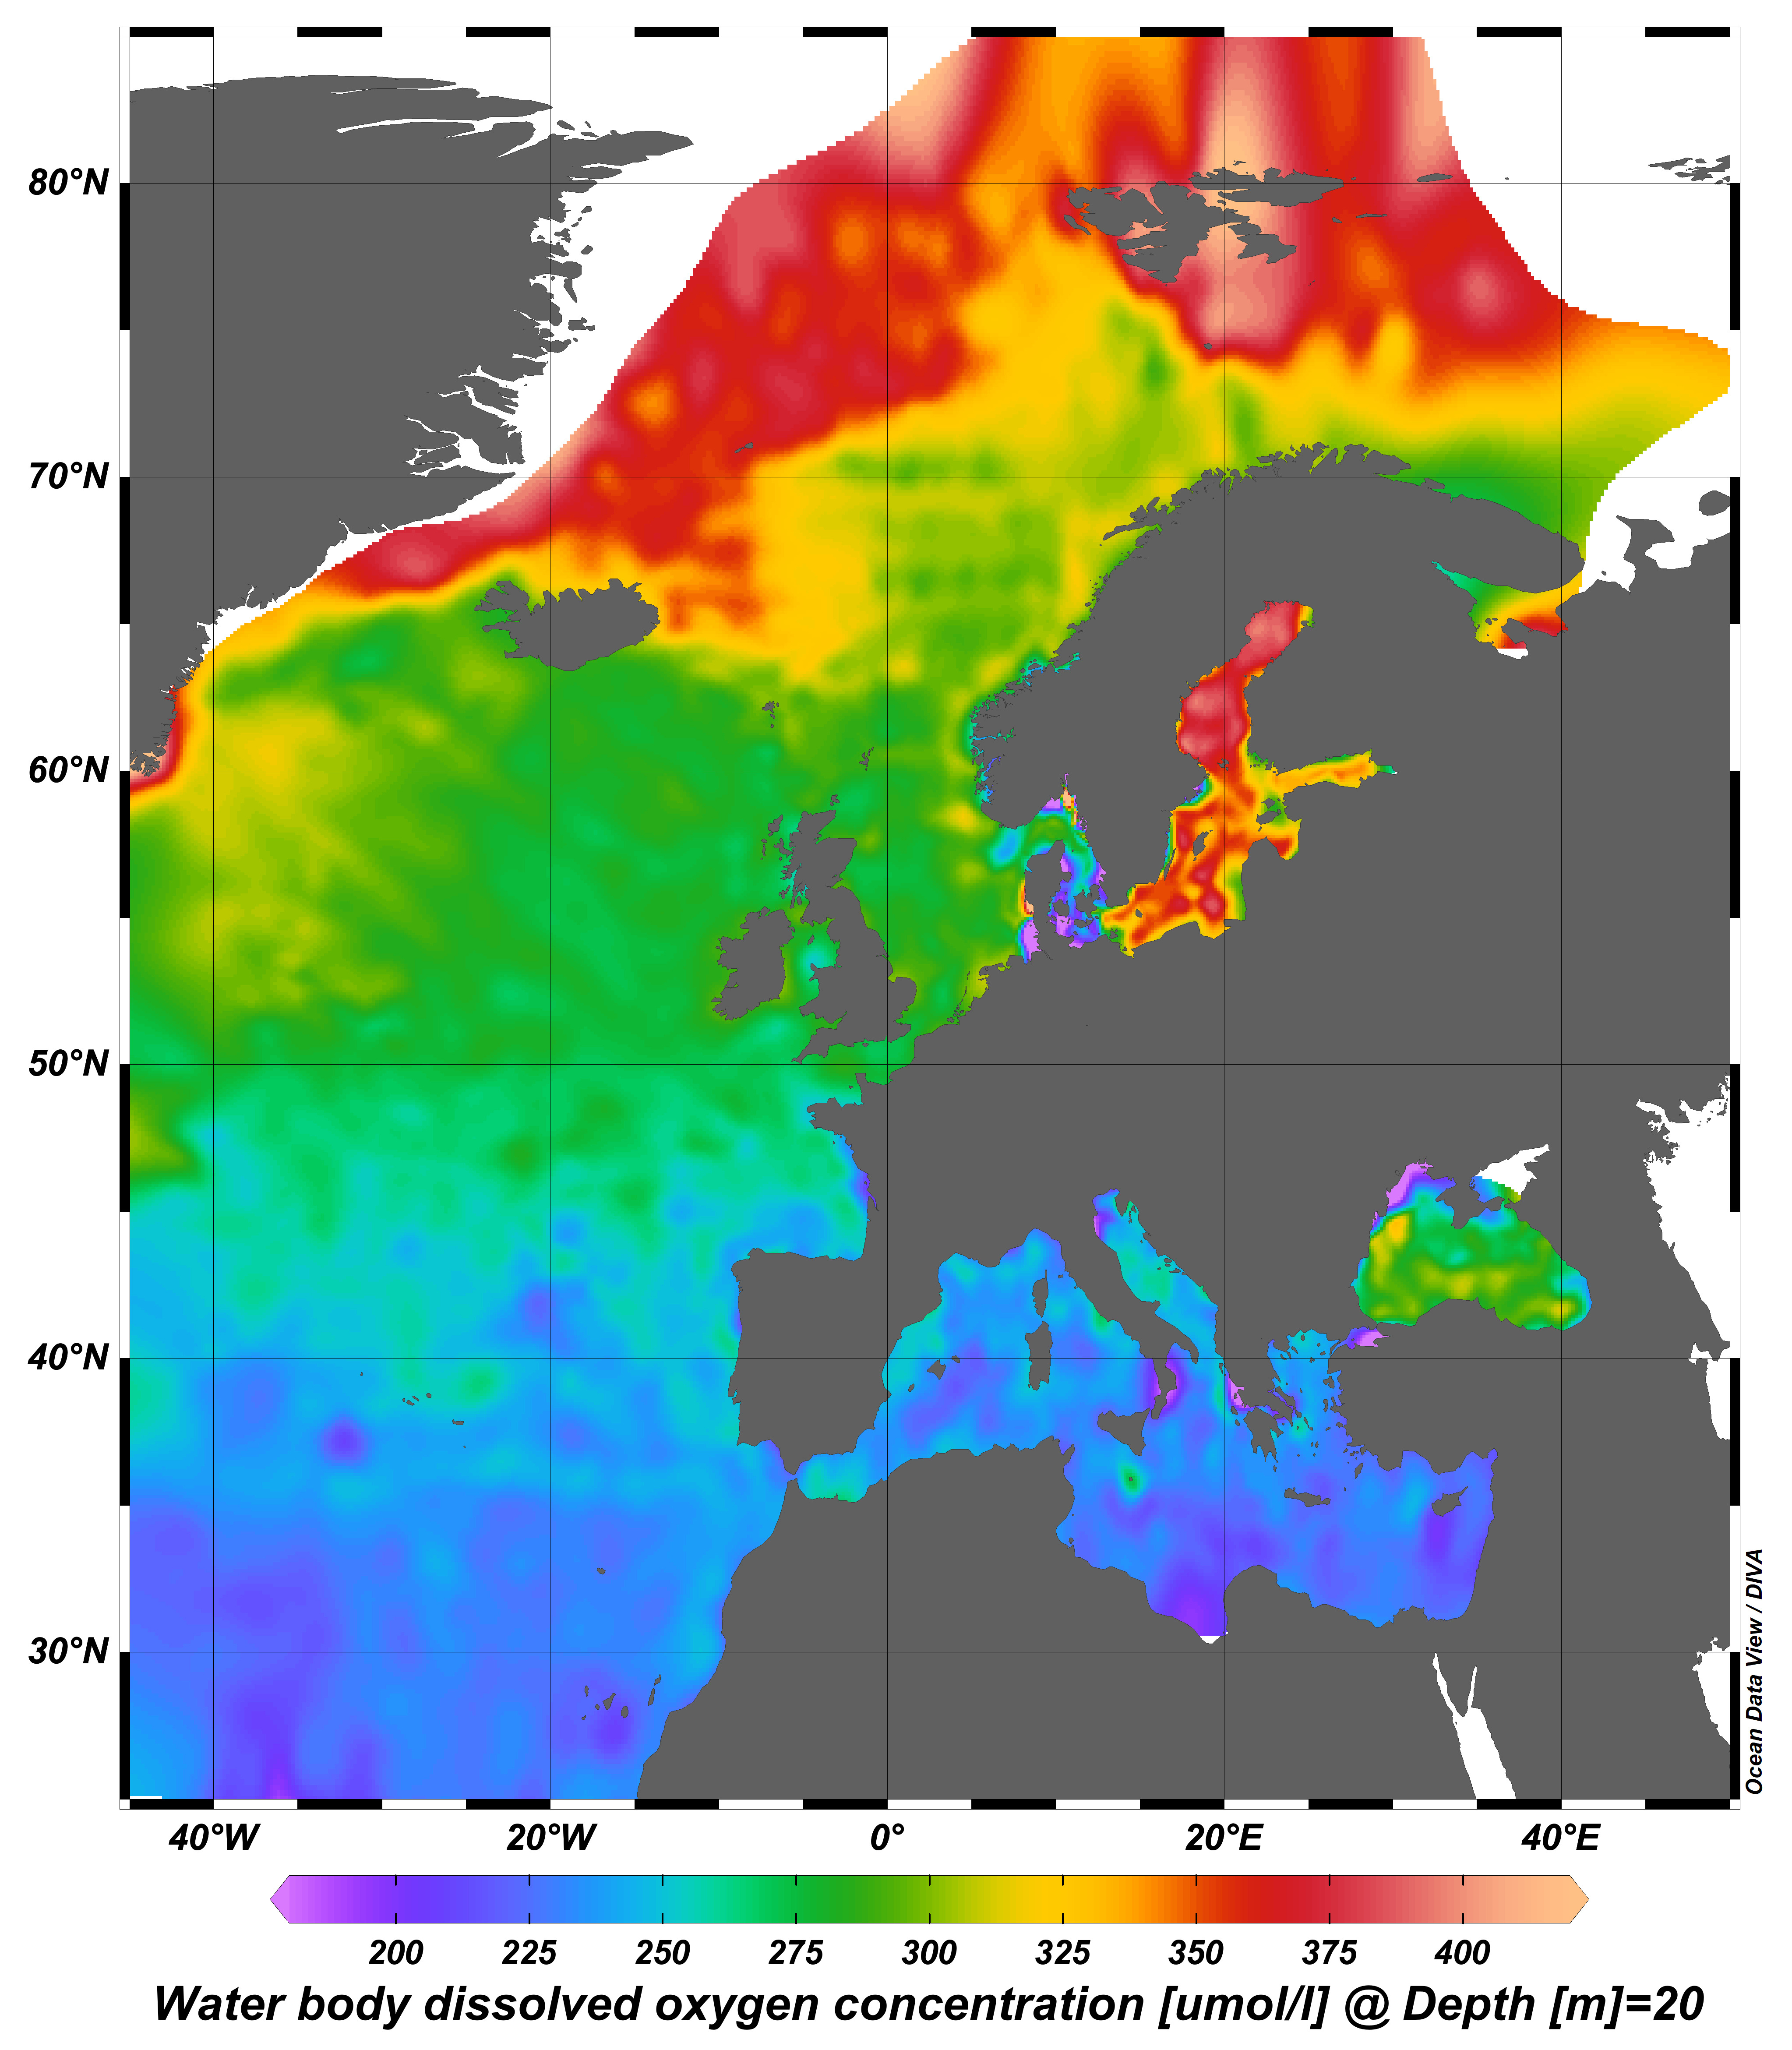
Repeat hydrography, as organized through the GO-SHIP network, is fundamental for detecting trends and variability also in the Mediterranean Sea. The Mediterranean component of GO-SHIP is MedSHIP, and TAlPro is the western Mediterranean component. The TAlPro2022 cruise consisted of 26 full depth hydrographic stations crossing the Tyrrhenian Sea from north to south, then the Algero-Provencal Basin from south to north. Here the postcalibrated bottle file data are made availiable. Postcalibration has been done by measuring dissolved oxygen and salinity on water samples collected by the rosette. The dataset contains also all chemical variables, measured in the lab.
-
webODV visualisations via WMS from the harmonized, standardized, validated data collections that EMODnet Chemistry is regularly producing and publishing for all European sea basins for eutrophication and contaminants. You can analyze, visualize, subset and download EMODnet Chemistry data using interactive webODV services. More information at: https://emodnet.ec.europa.eu/en/chemistry#chemistry-services
-
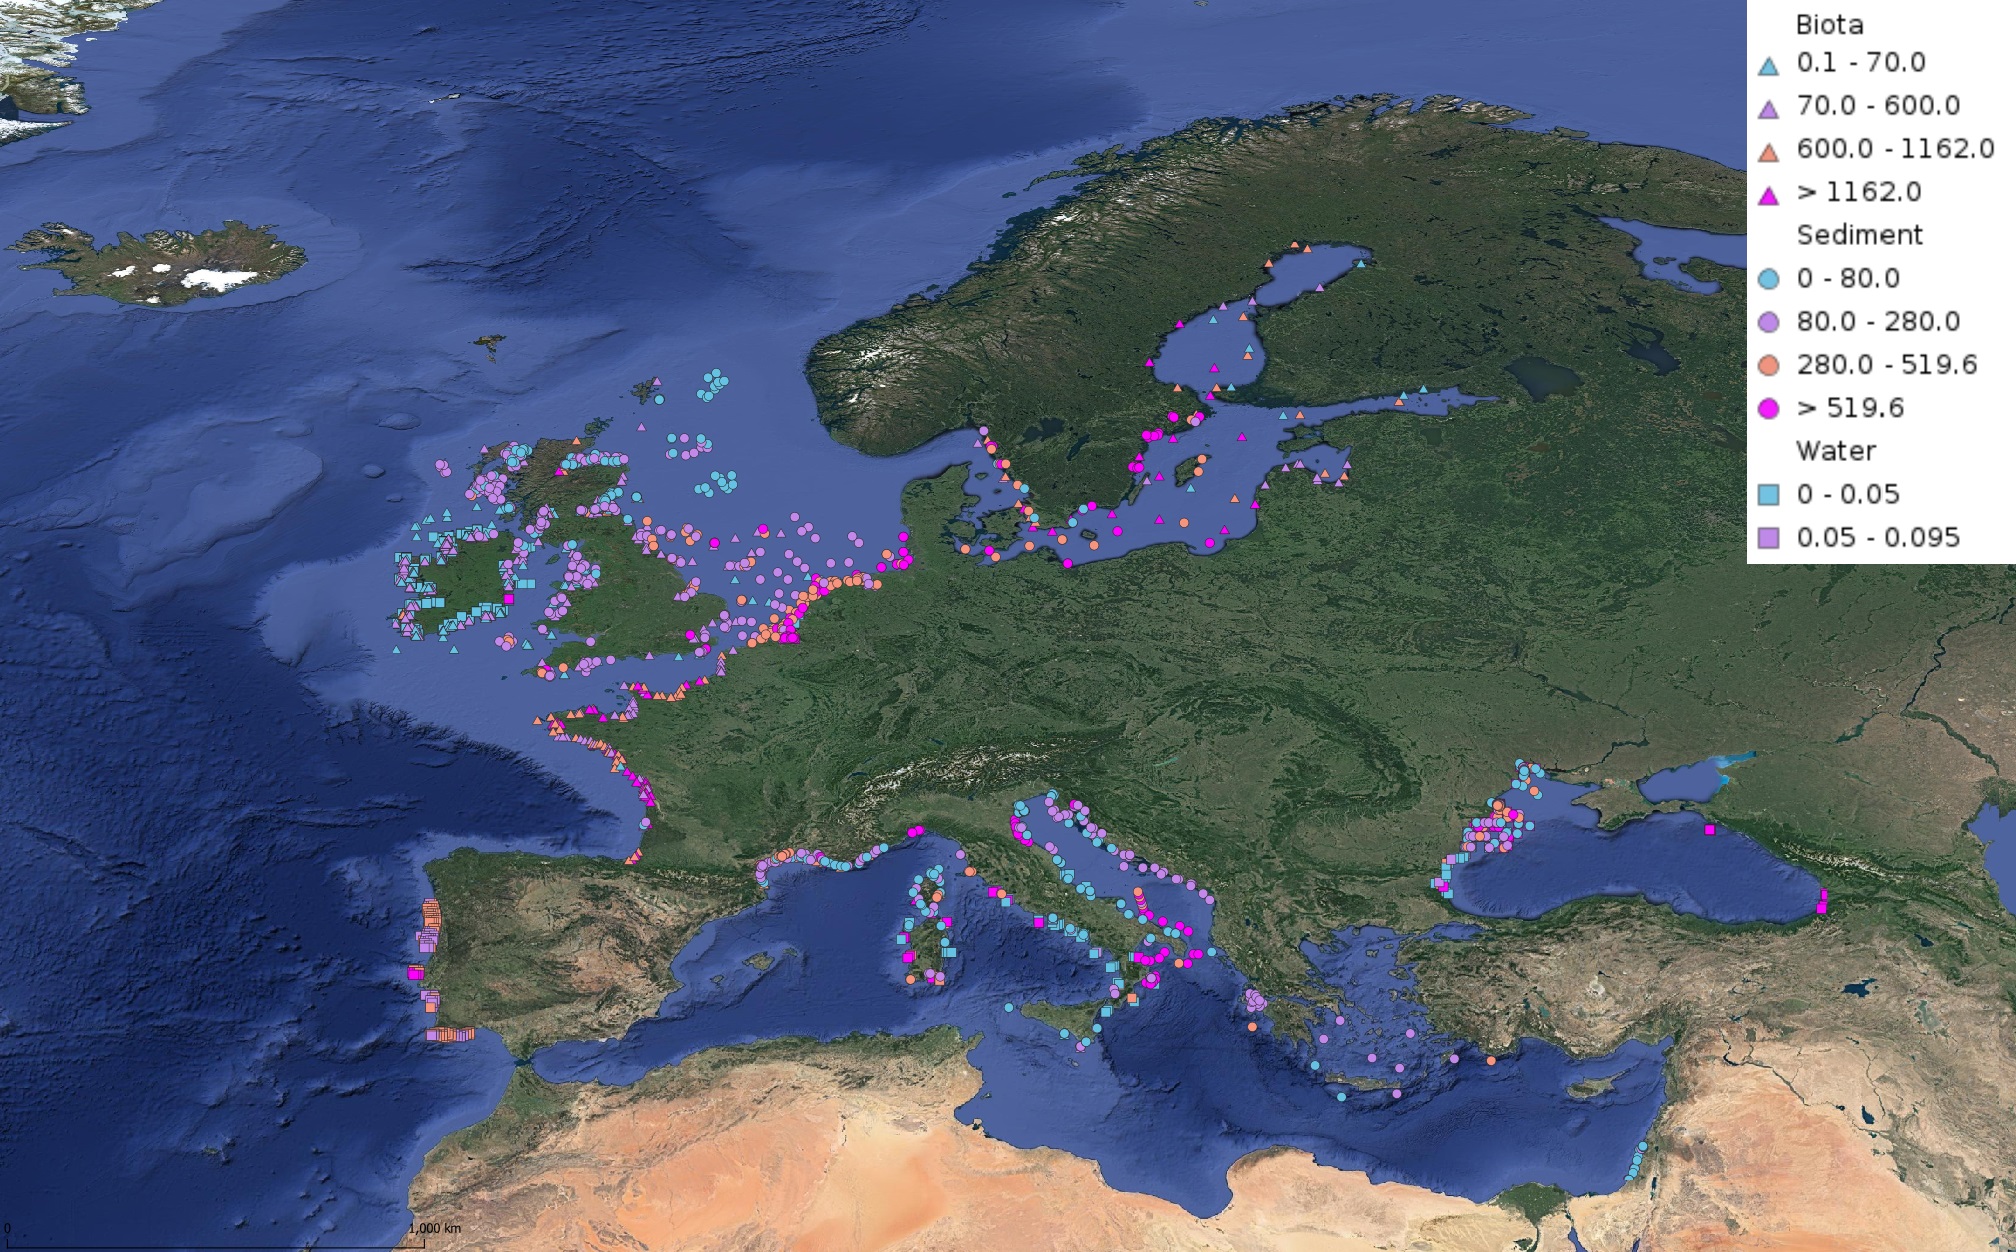
This product displays for Cadmium, median values of the last 6 available years that have been measured per matrix and are present in EMODnet validated datasets. The median values ranges are derived from the following percentiles: 0-25%, 25-75%, 75-90%, >90%. Only "good data" are used, namely data with Quality Flag=1, 2, 6, Q (SeaDataNet Quality Flag schema). For water, only surface values are used (0-15 m), for sediment and biota data at all depths are used.
-
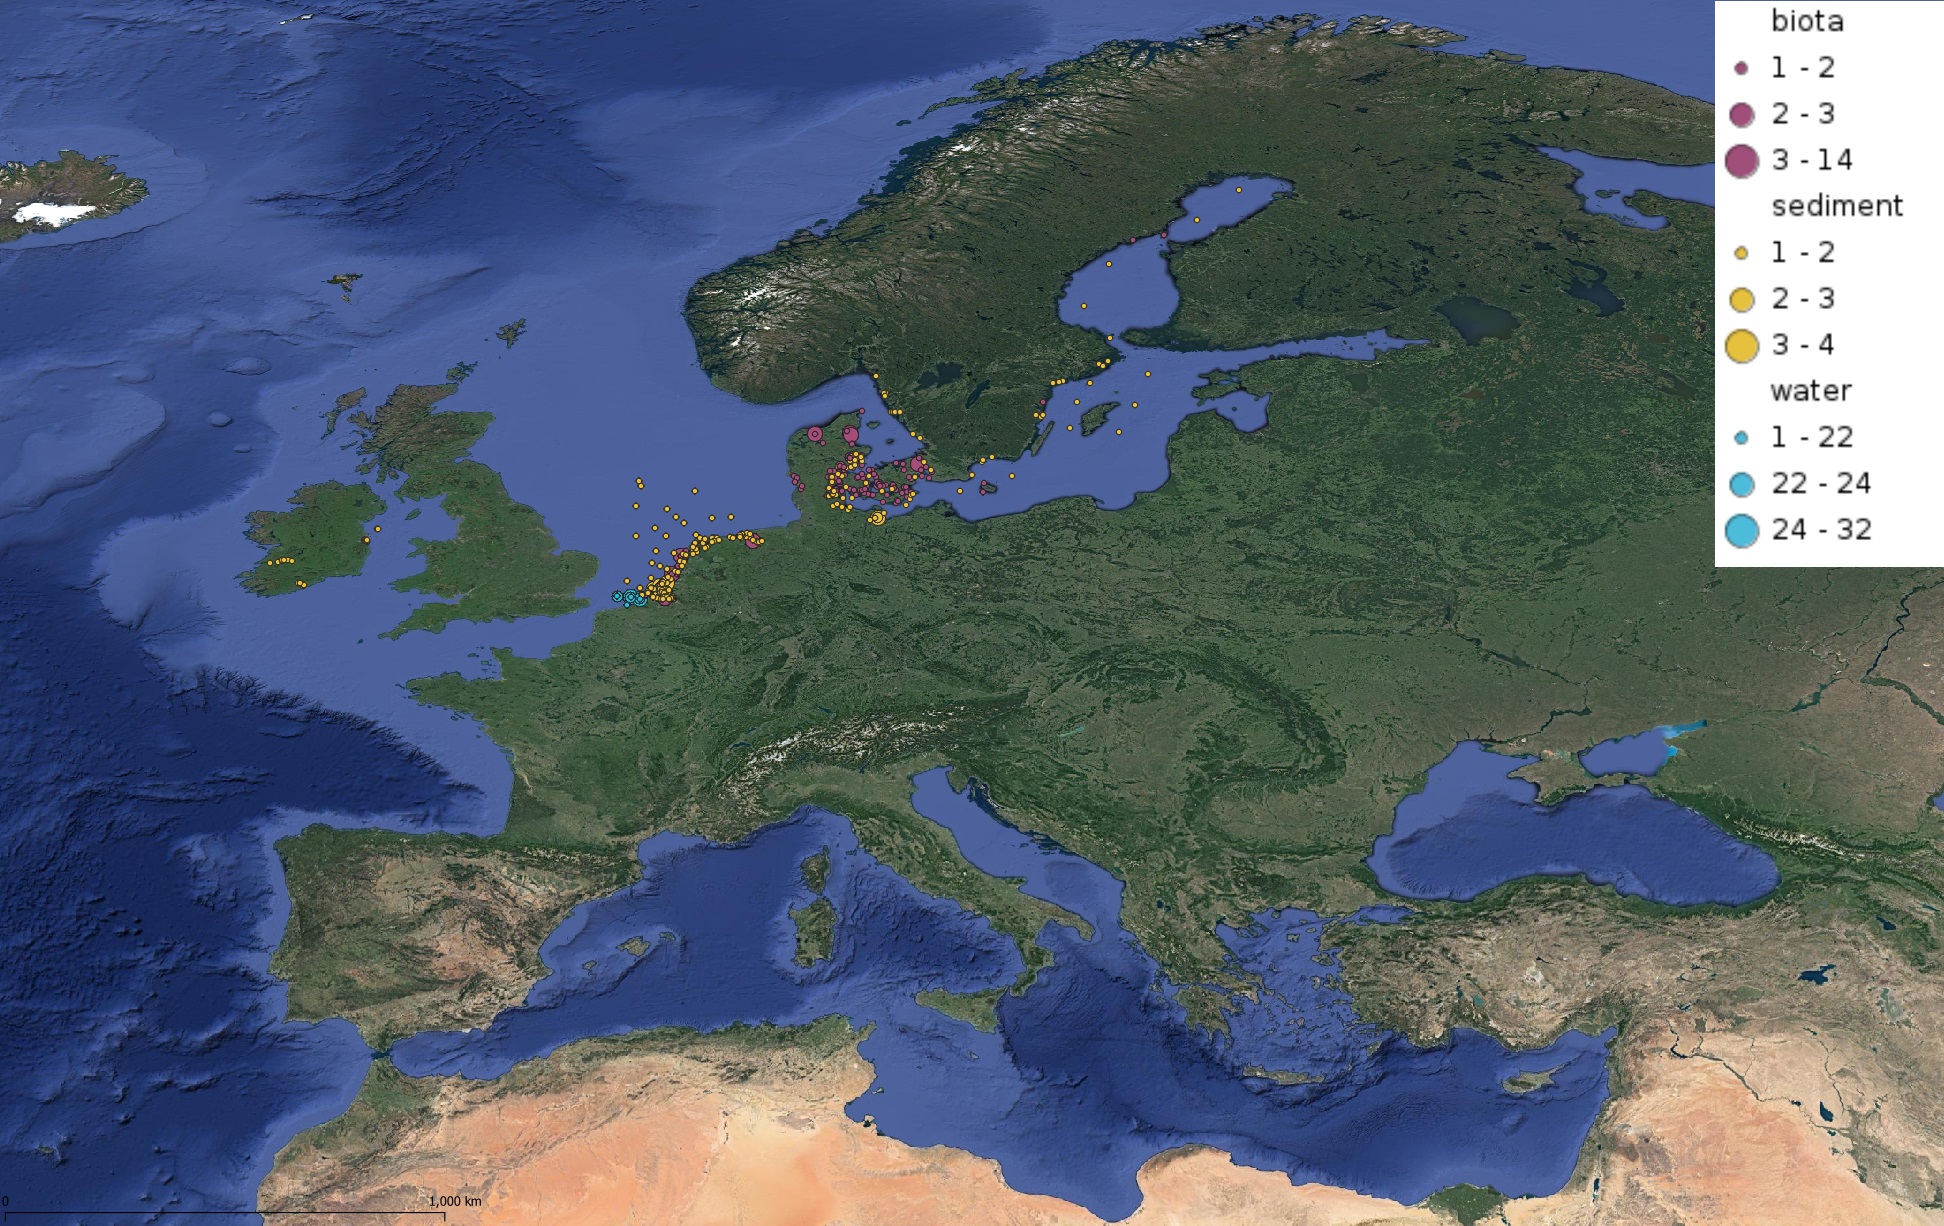
This product displays for Triphenyltin, positions with values counts that have been measured per matrix and are present in EMODnet validated datasets. The product displays positions for all available years and per year.
-
This product displays for Tributyltin, positions with values counts that have been measured per matrix and are present in EMODnet validated datasets. The product displays positions for all available years and per year.
-
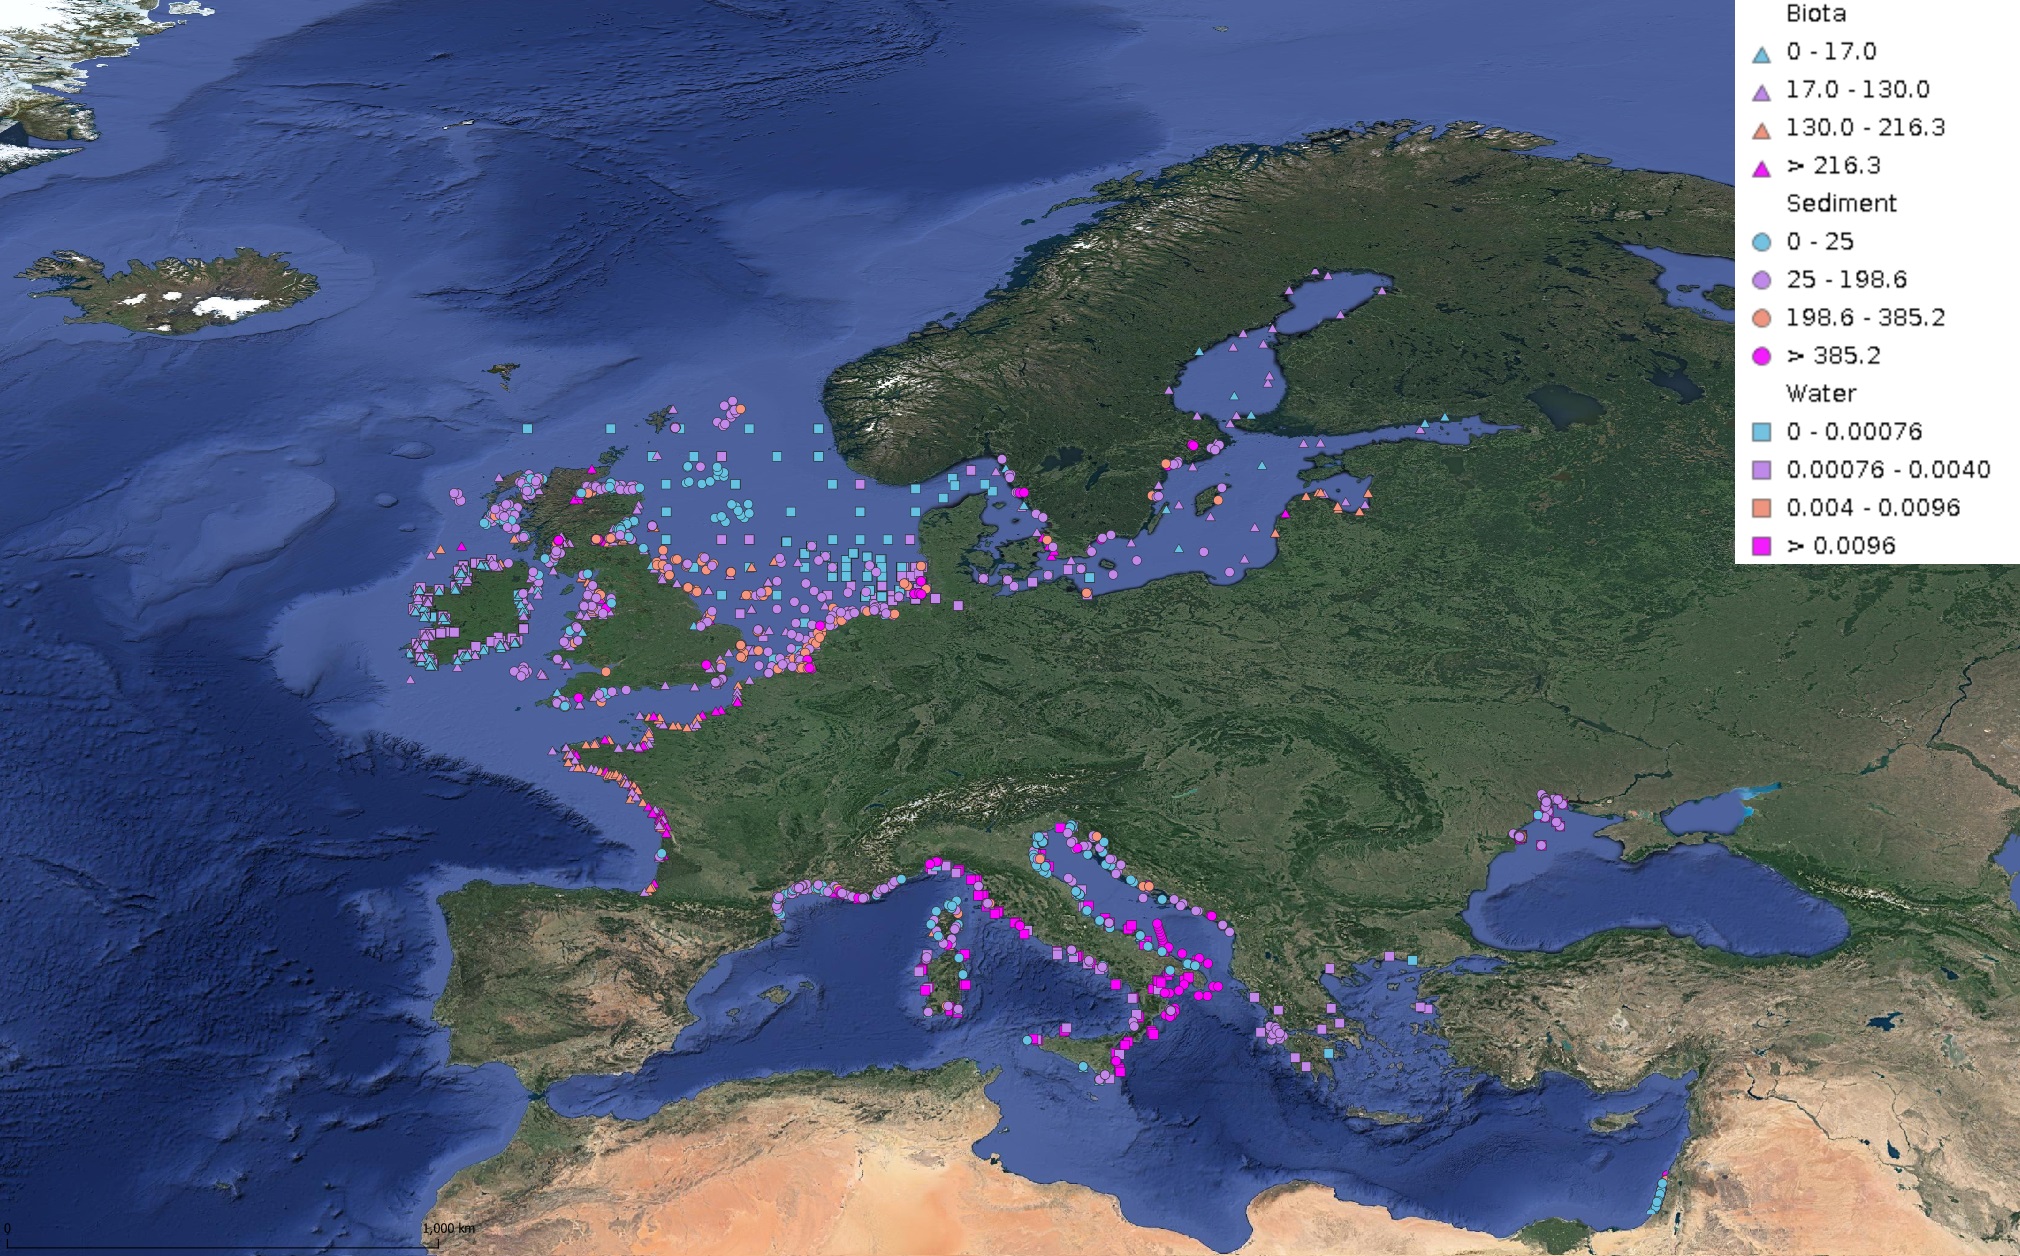
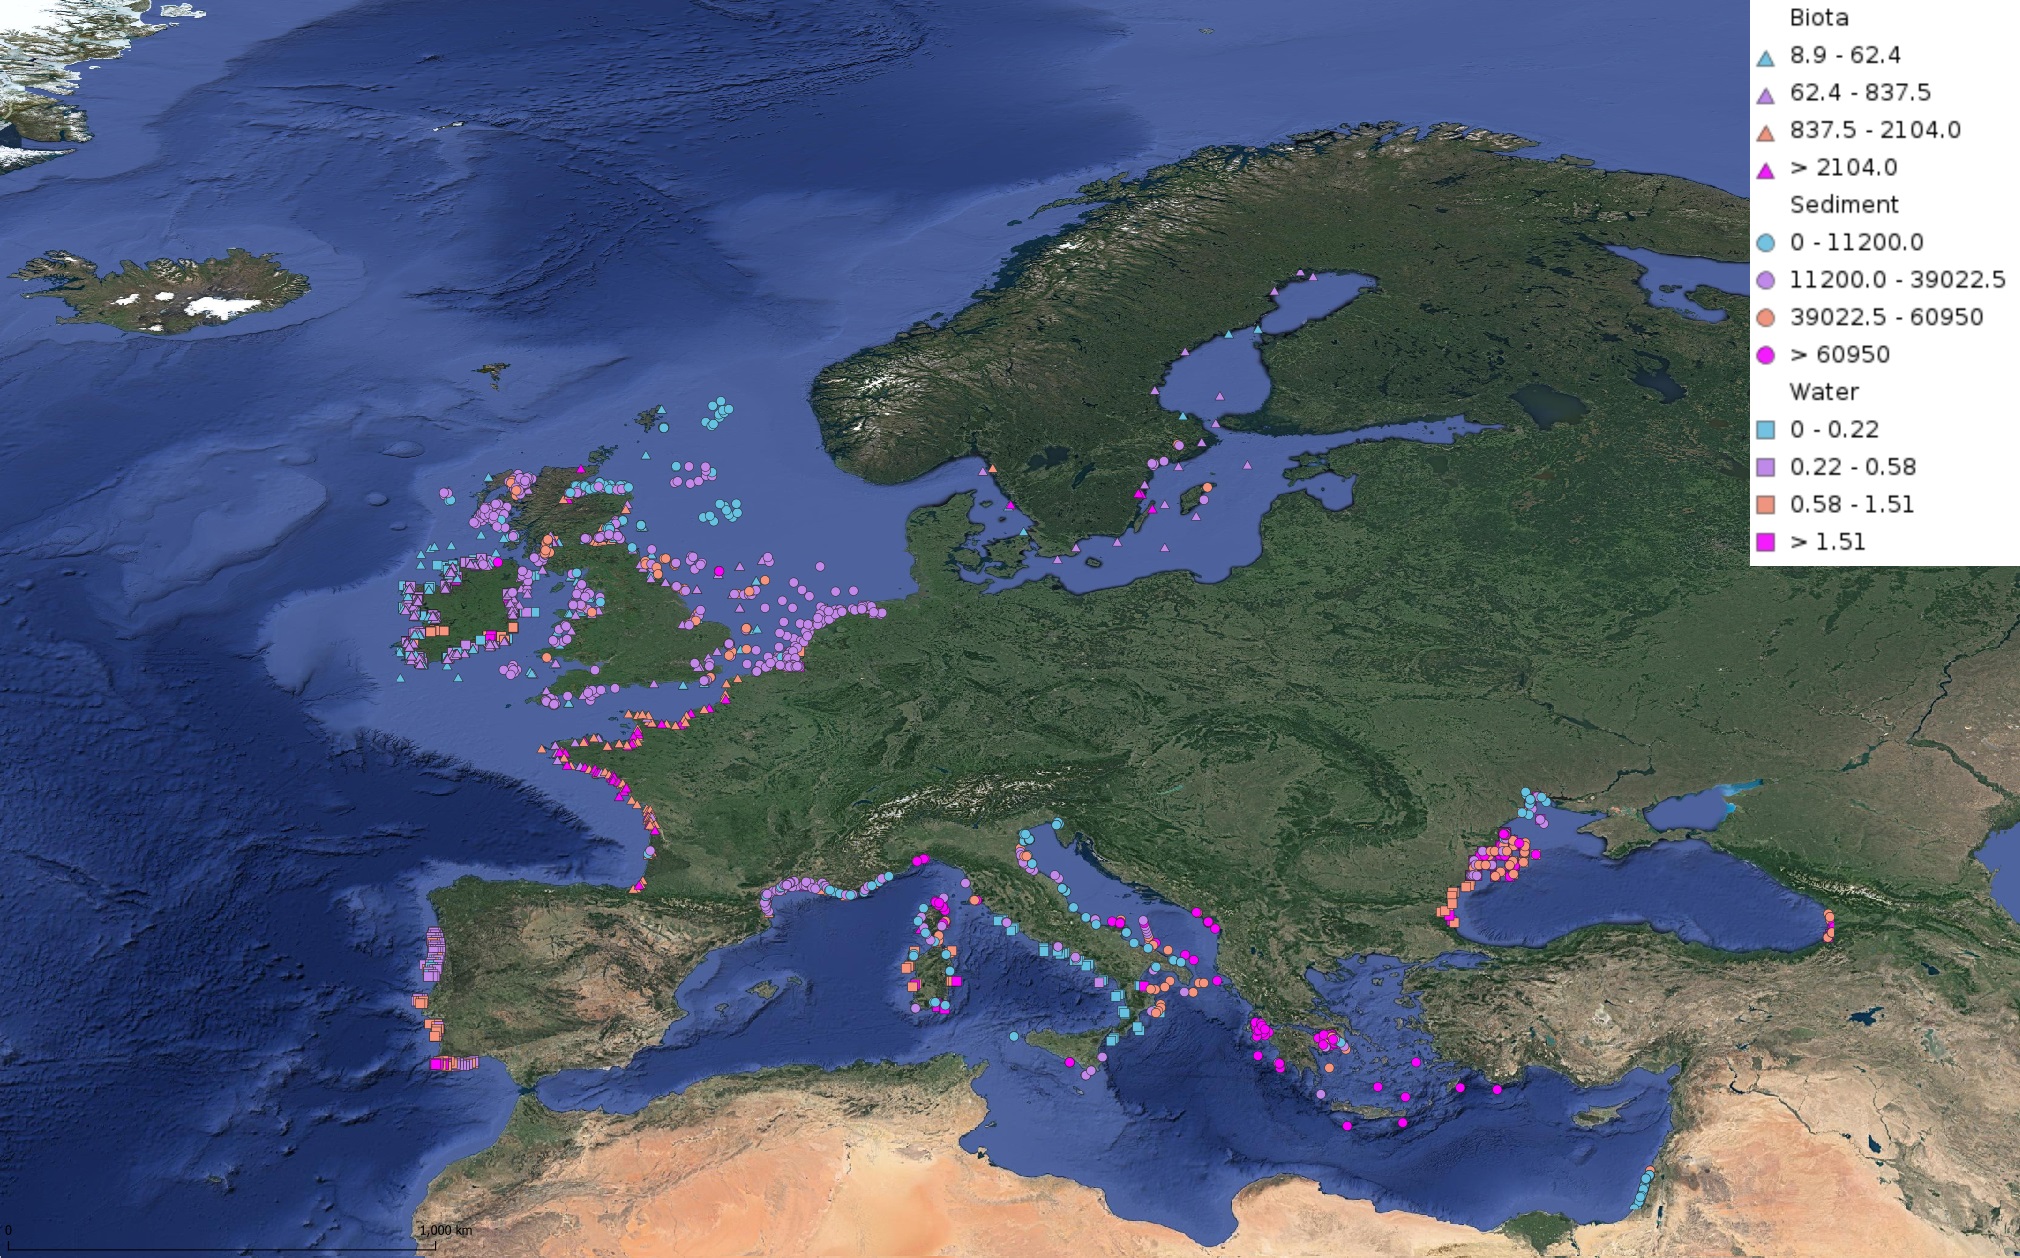
This product displays for Mercury, median values of the last 6 available years that have been measured per matrix and are present in EMODnet validated datasets. The median values ranges are derived from the following percentiles: 0-25%, 25-75%, 75-90%, >90%. Only "good data" are used, namely data with Quality Flag=1, 2, 6, Q (SeaDataNet Quality Flag schema). For water, only surface values are used (0-15 m), for sediment and biota data at all depths are used.
-
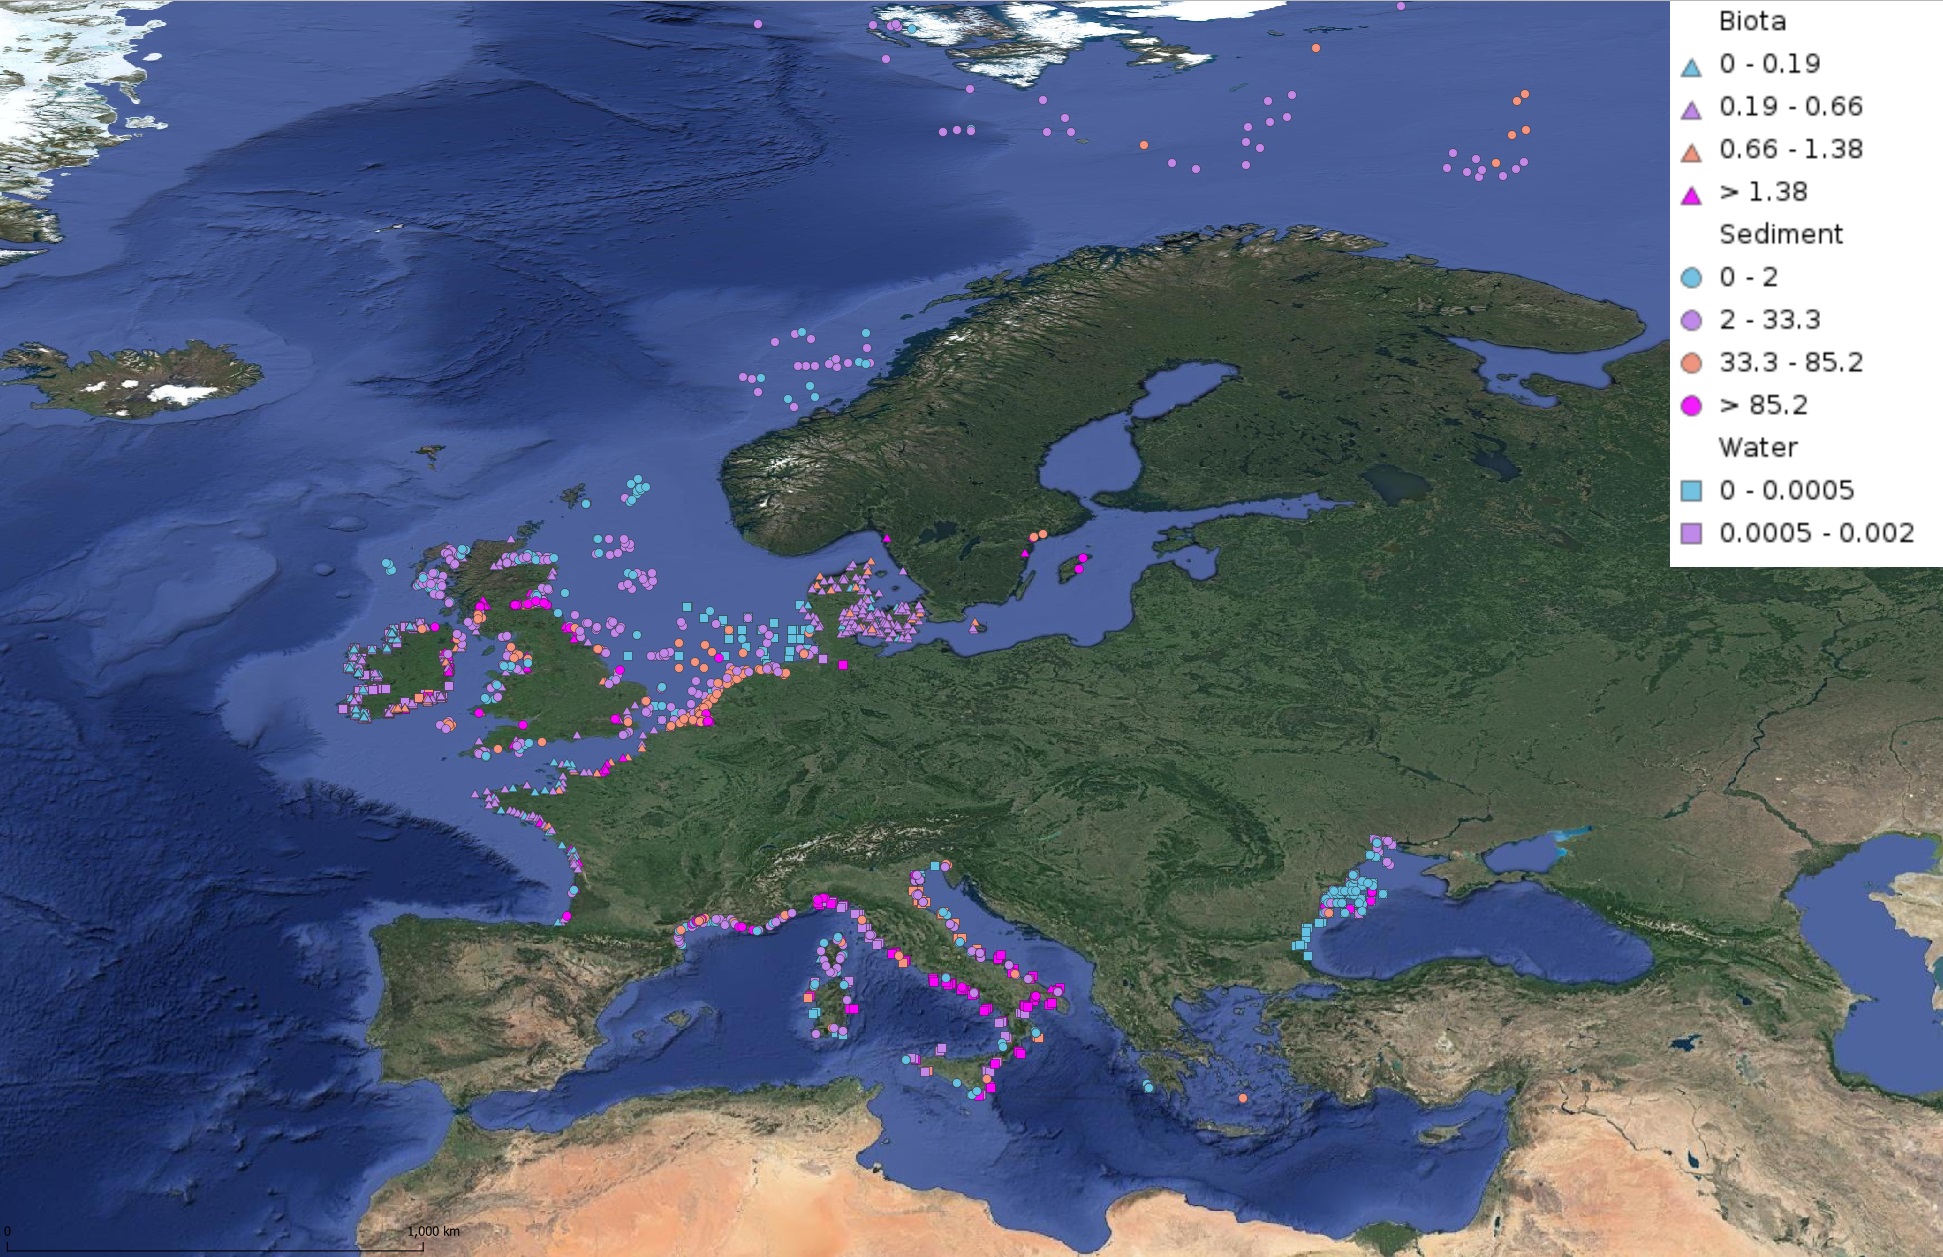
This product displays for Benzo(a)pyrene, median values of the last 6 available years that have been measured per matrix and are present in EMODnet validated datasets. The median values ranges are derived from the following percentiles: 0-25%, 25-75%, 75-90%, >90%. Only "good data" are used, namely data with Quality Flag=1, 2, 6, Q (SeaDataNet Quality Flag schema). For water, only surface values are used (0-15 m), for sediment and biota data at all depths are used.
-
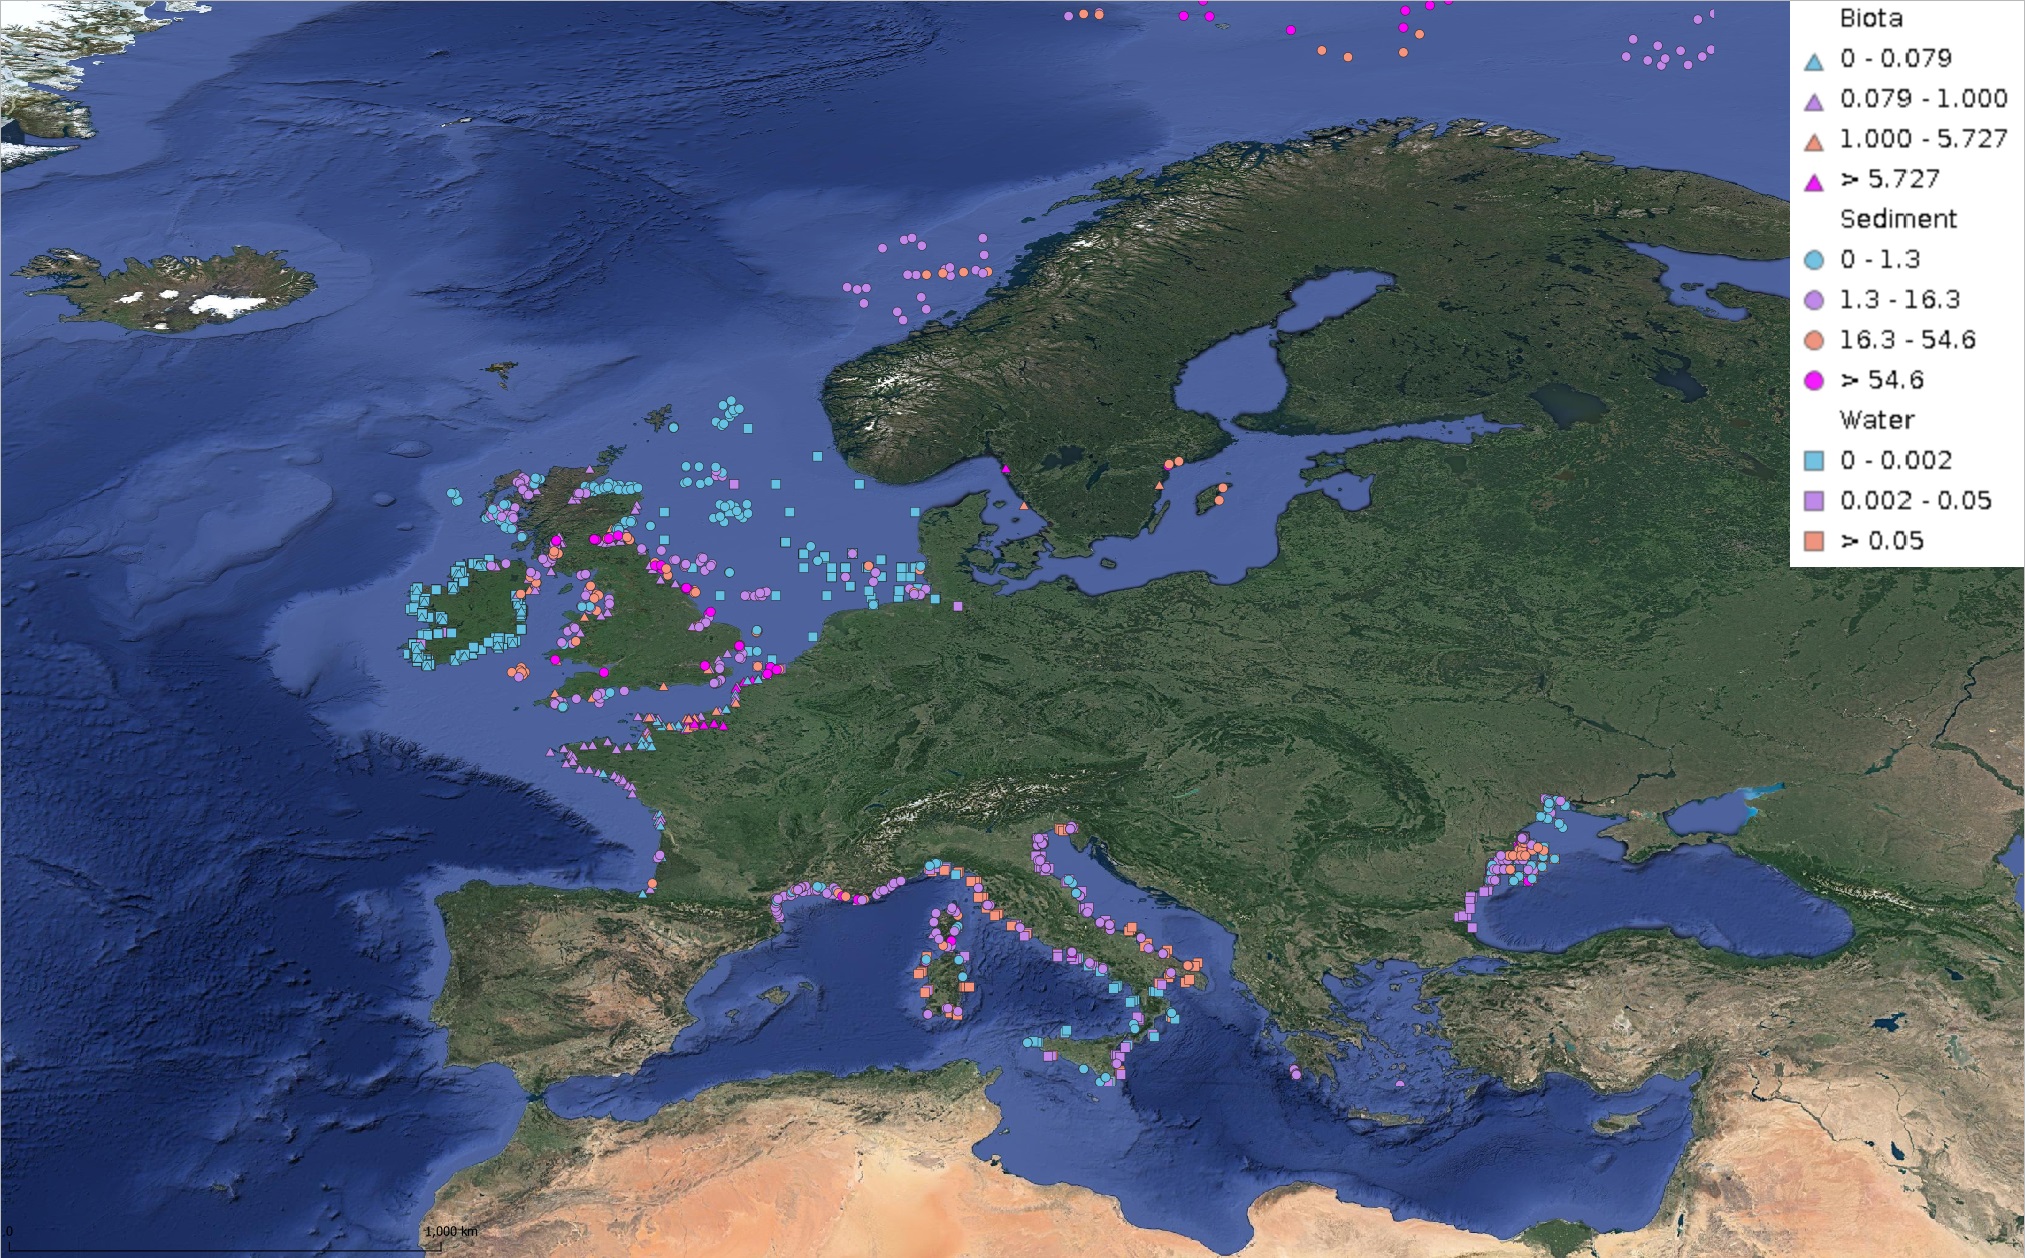
This product displays for Naphthalene, median values of the last 6 available years that have been measured per matrix and are present in EMODnet validated datasets. The median values ranges are derived from the following percentiles: 0-25%, 25-75%, 75-90%, >90%. Only "good data" are used, namely data with Quality Flag=1, 2, 6, Q (SeaDataNet Quality Flag schema). For water, only surface values are used (0-15 m), for sediment and biota data at all depths are used.
-
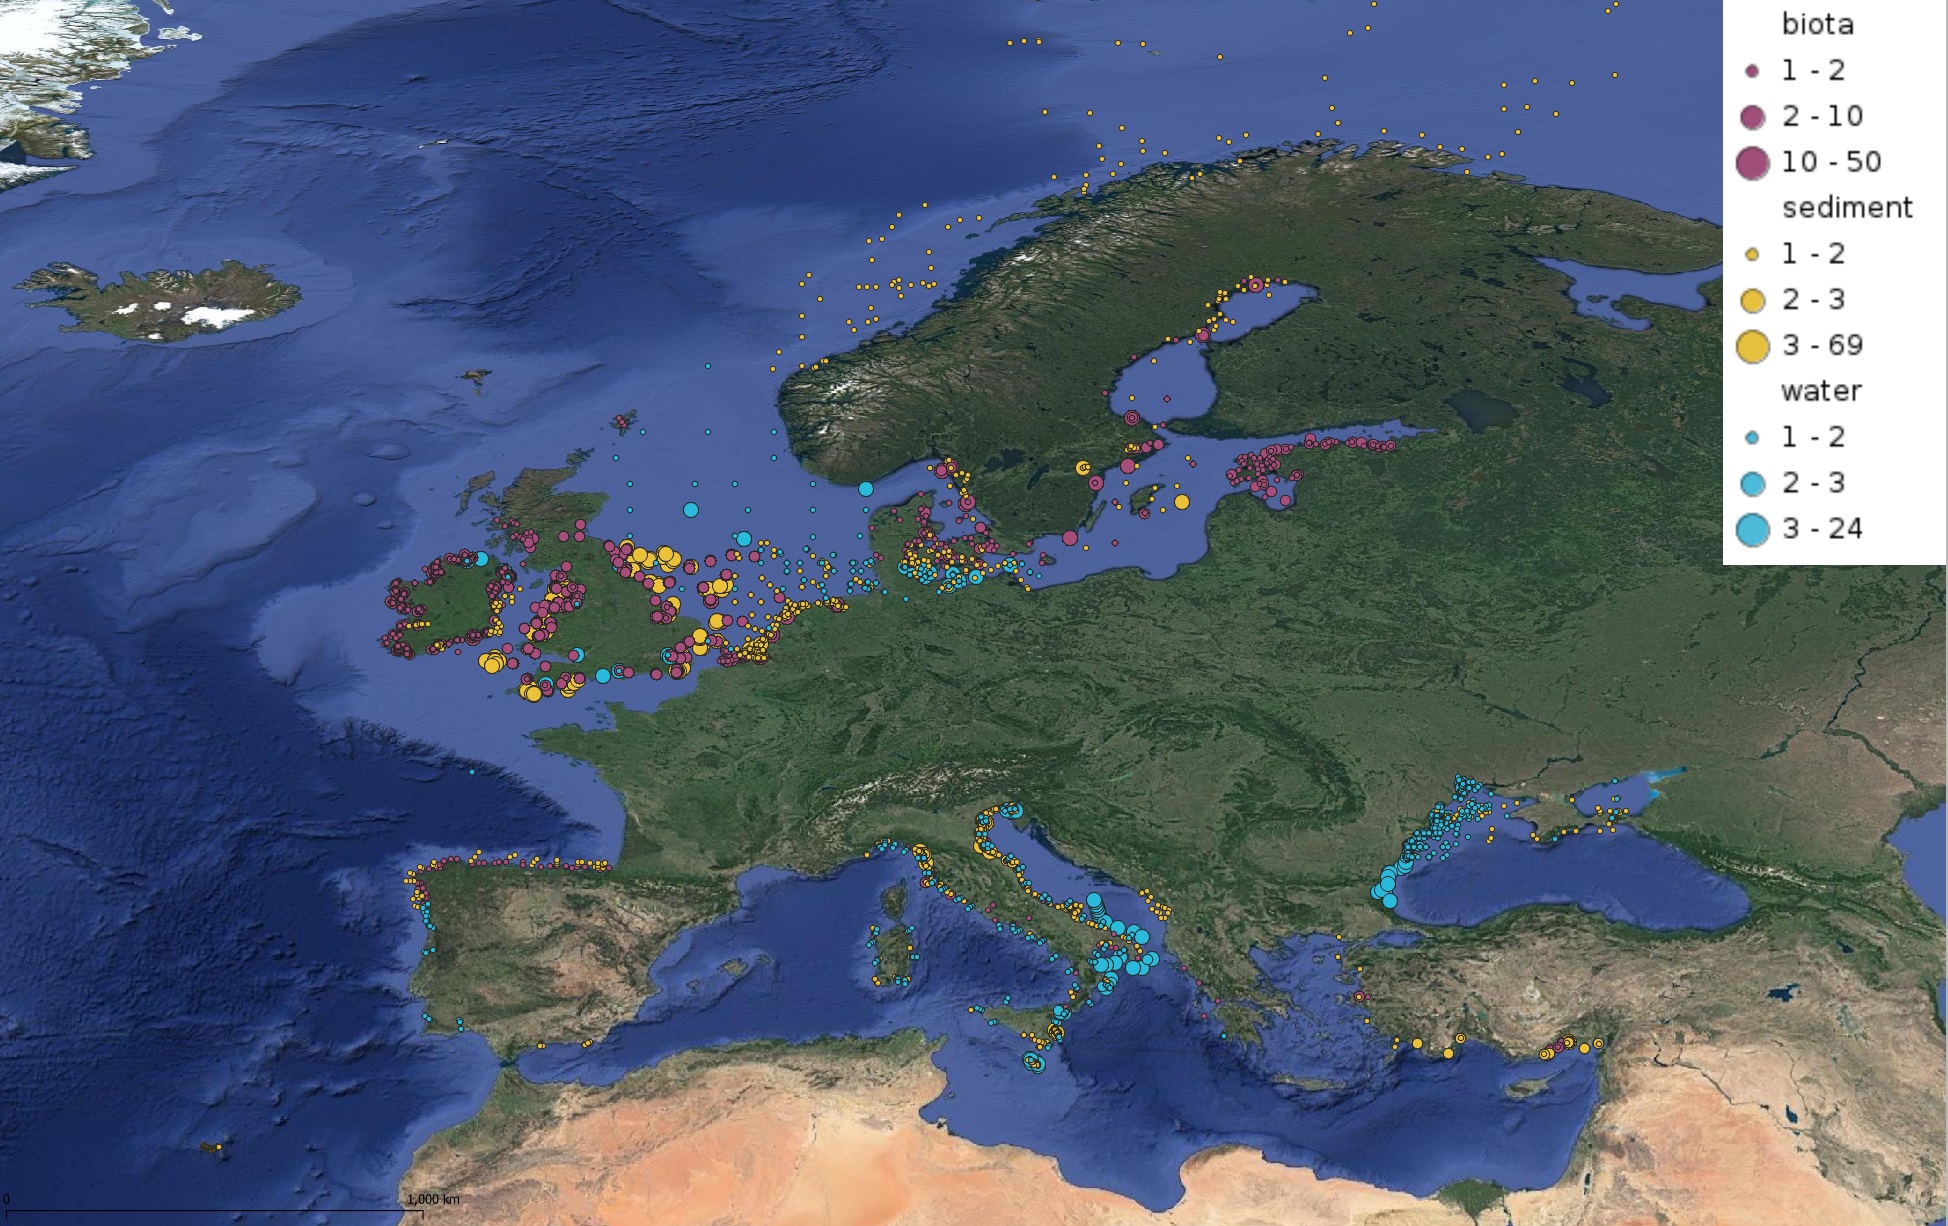
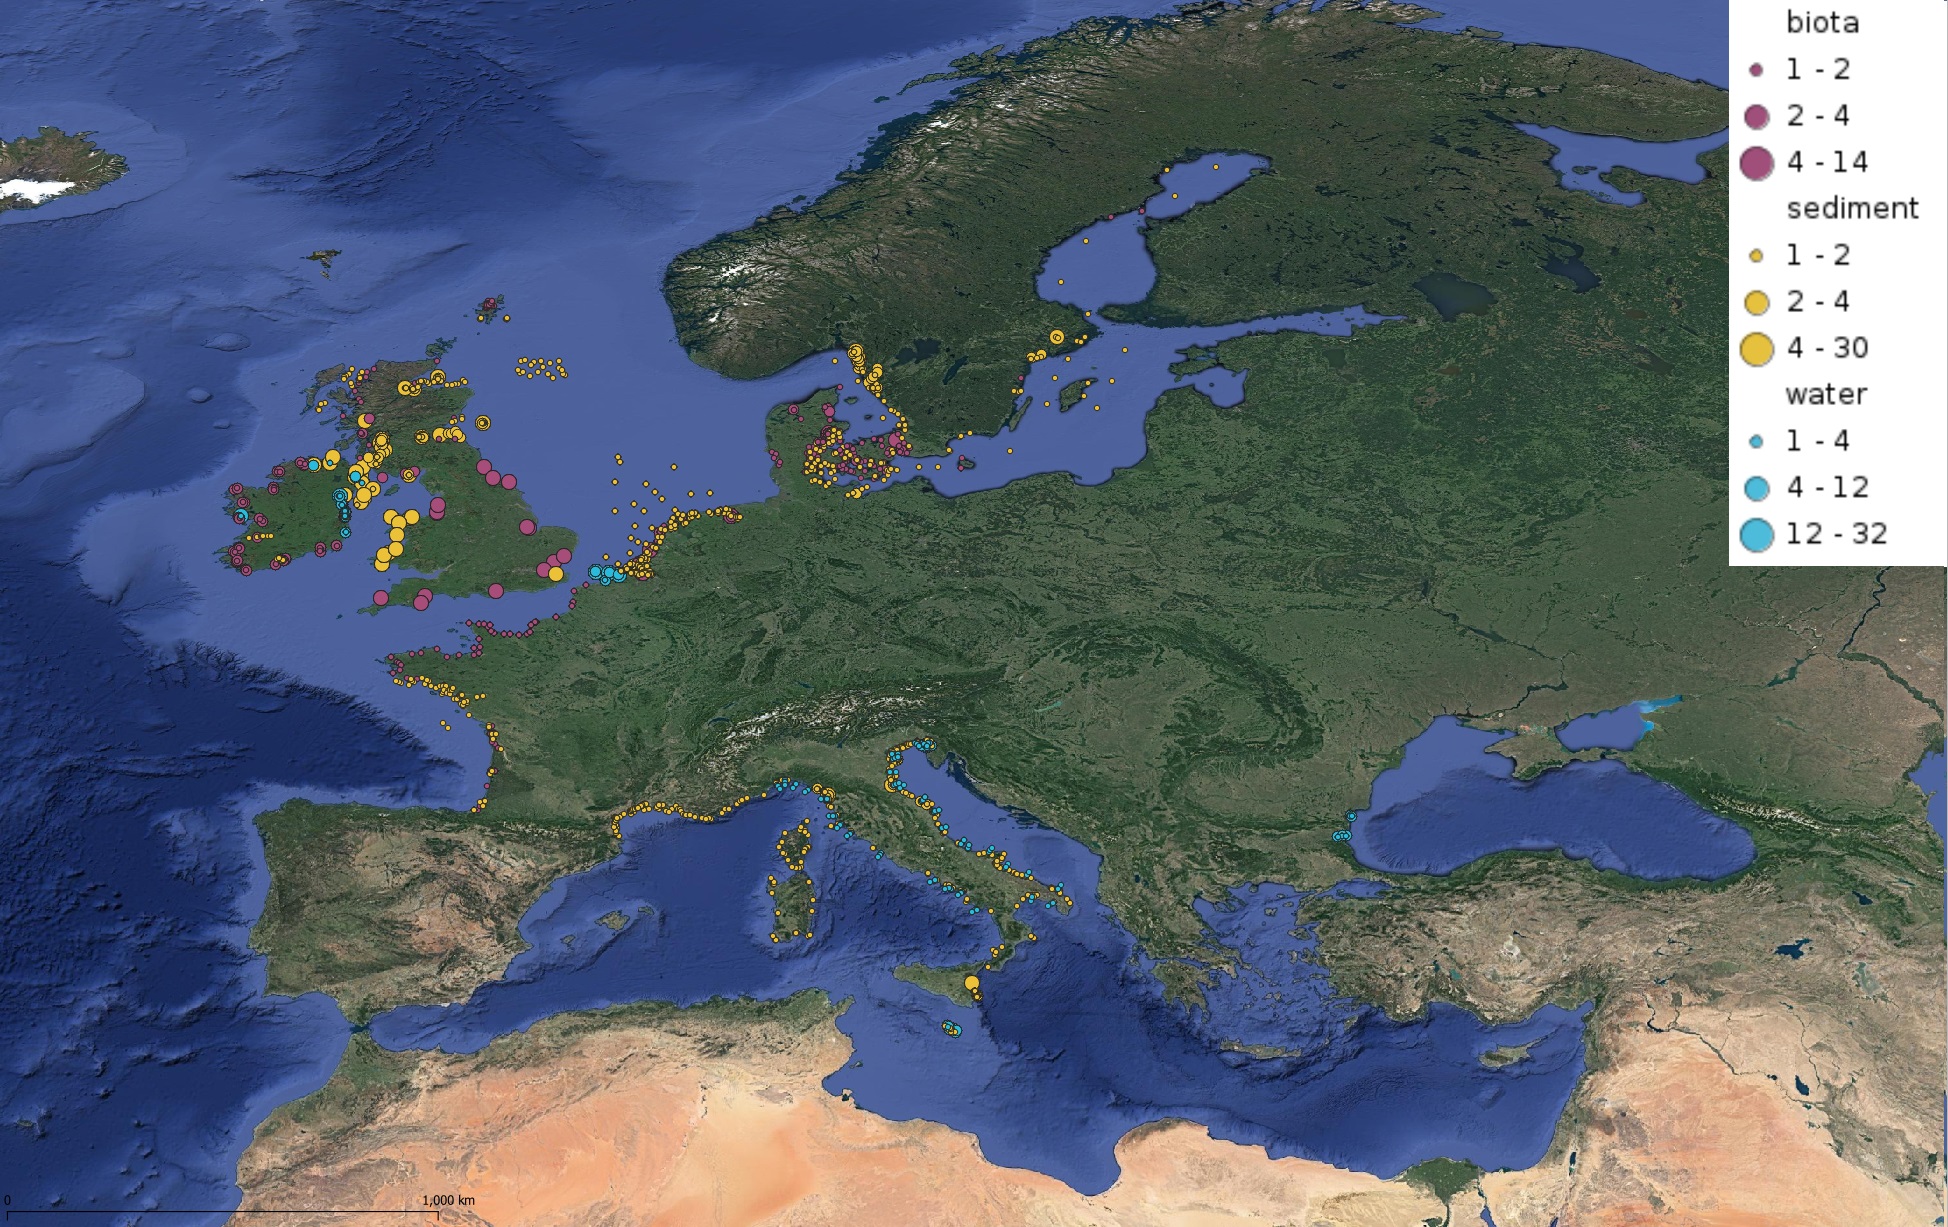
This product displays for Hexachlorobenzene, positions with values counts that have been measured per matrix and are present in EMODnet validated datasets. The product displays positions for all available years and per year.
-
This product displays for Nickel, median values of the last 6 available years that have been measured per matrix and are present in EMODnet validated datasets. The median values ranges are derived from the following percentiles: 0-25%, 25-75%, 75-90%, >90%. Only "good data" are used, namely data with Quality Flag=1, 2, 6, Q (SeaDataNet Quality Flag schema). For water, only surface values are used (0-15 m), for sediment and biota data at all depths are used.